Tableau for Data Visualization
Tableau Data Visualization Essentials
Learn how to build impactful data visualizations and interactive dashboards. Enroll in this Tableau course and gain skills in visual analytics, chart types, parameters, storytelling, key business intelligence, and reporting roles.
About this course
This Data Visualization using Tableau course equips you with the essential skills to create powerful visualizations and analyze data effectively. You’ll learn to structure data for accurate analysis, create basic and advanced charts, and work with parameters to build dynamic, interactive visualizations. This course also covers dashboarding, where you’ll combine multiple visualizations to create impactful presentations, and storytelling, helping you craft clear, data-driven narratives.
Through hands-on projects, you’ll apply these skills to real-world data, gaining experience in analyzing trends and making data-driven decisions. By the end of the Data Visualization with Tableau course, you’ll be able to design interactive dashboards, visualize complex data, and present insights effectively, preparing you to excel in data-focused roles and drive business success.
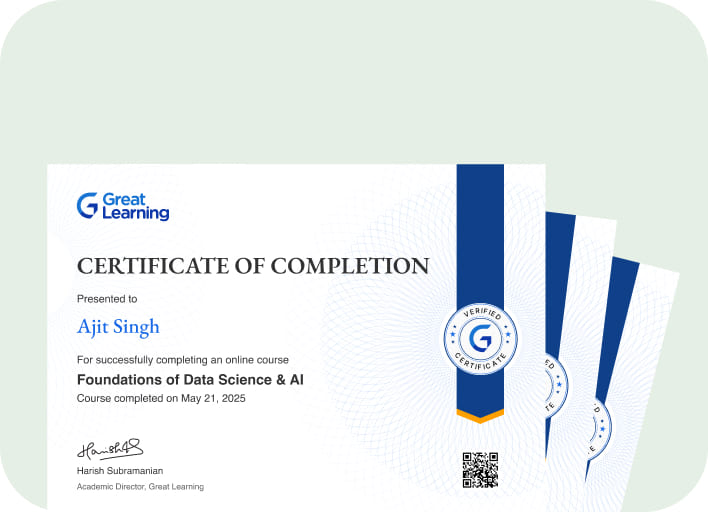
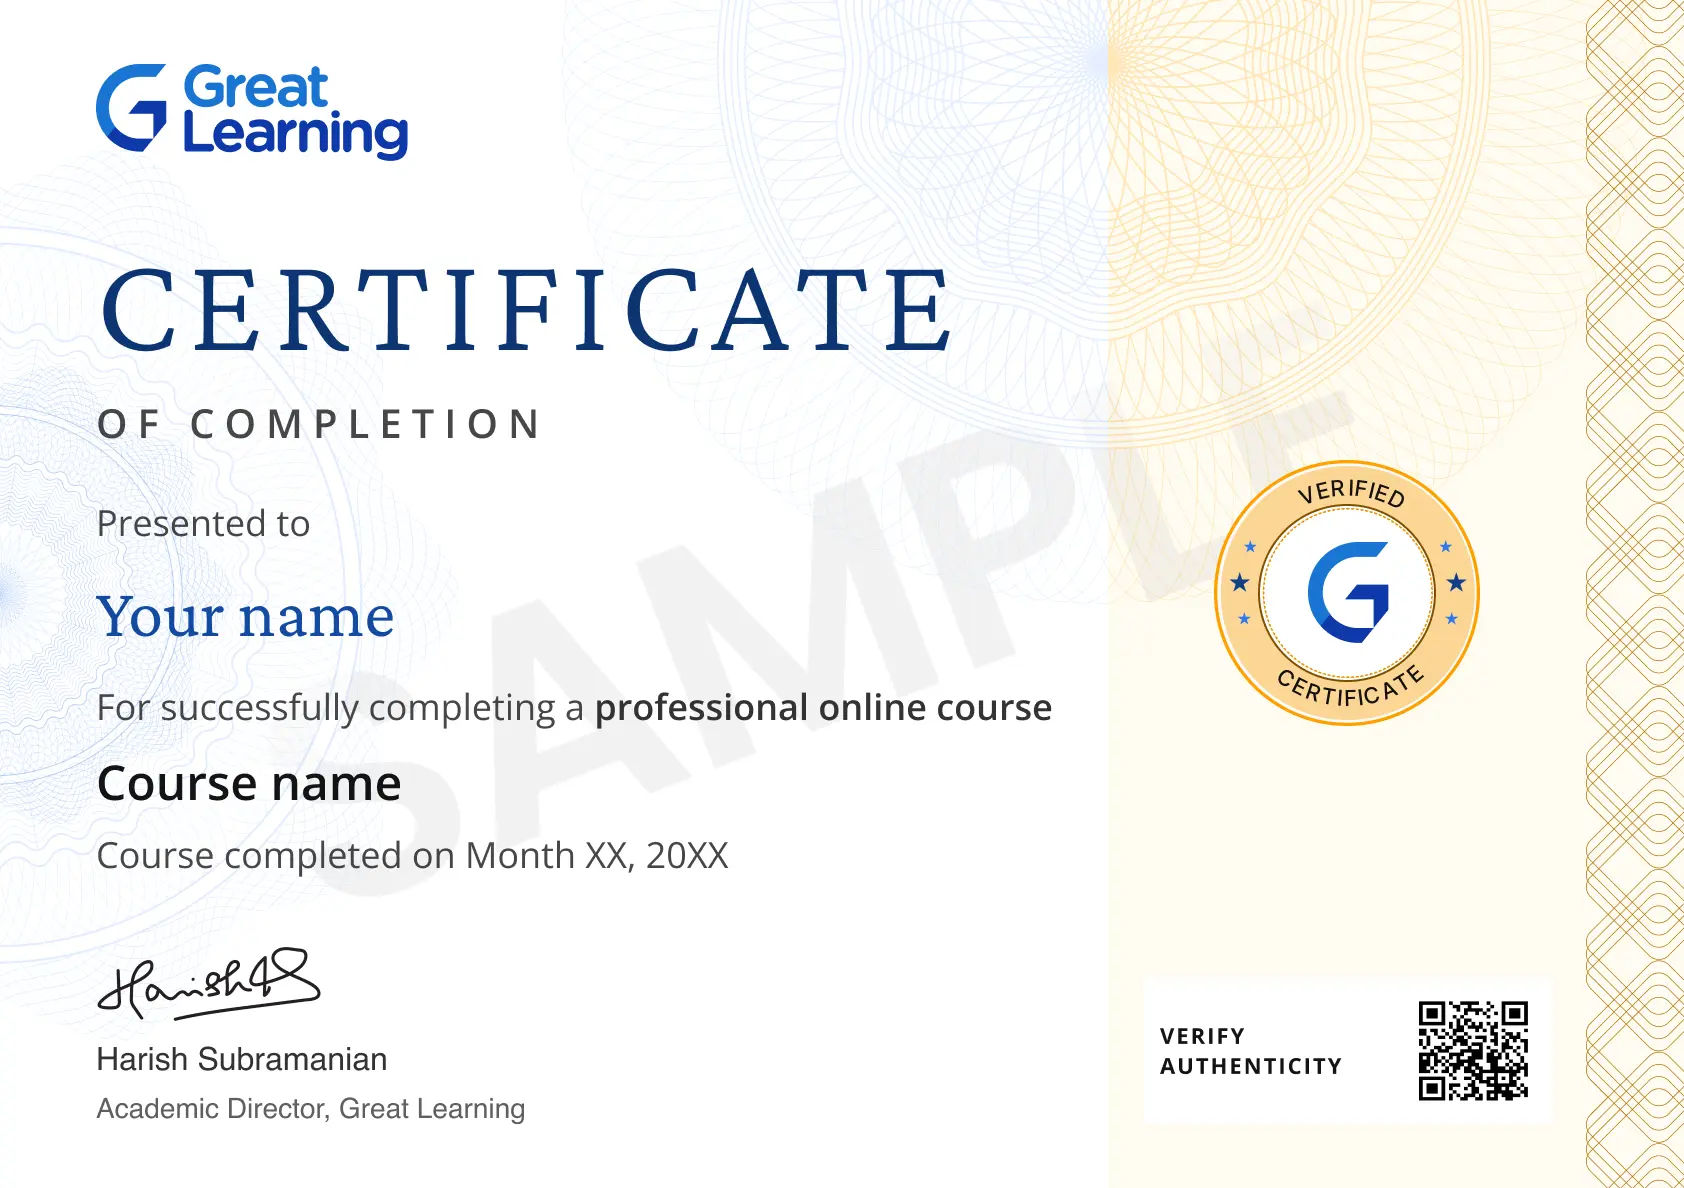
Earn a certificate with an Academy Pro+ subscription
Stand out to recruiters
Share on professional channels
Globally recognised
Land your dream job
Course outline
Industry focussed curriculum designed by experts
Introduction to Visual Analytics & Data Structure
6 items
1 hr
- Visual Analytics Overview
- Rules of Data Structure & Data Walkthrough
- Importing Data into Tableau
- Data Types in Tableau
- Dimensions and Measures
- Numbers vs Visuals
Basic Charts & Calculations
3 items
1.21 hr
- Special Types of Charts
- Funnel and Control Charts
- Advanced Calculations in Tableau
Advanced Chart Types
6 items
1.05 hr
- Highlight Table
- Heat Map
- Tree Map
- Bullet Graph
- Special Charts - Pareto Chart
- KPI Controls
Working with Parameters
3 items
1.08 hr
- Parameters
- Sorting with Parameters
- What if Analysis with Parameters
Dashboarding in Tableau
4 items
2 hr
- Intro to Dashboards
- Building Dashboards
- Dashboard Actions - Part 1
- Dashboard Actions - Part 2
Storytelling with Tableau
4 items
1.09 hr
- Storyboarding 101 - Basics
- Storyboarding 101 - Blueprint
- Storyboarding Hands-on Part 1
- Storyboarding Hands-on Part 2
Get access to the complete curriculum with your free trial
Start 7-Day Free TrialGuided Projects
Solve real-world projects in this Tableau training course with step-by-step guides, starter code templates, and access to model solutions to boost your skills and build a standout resume.
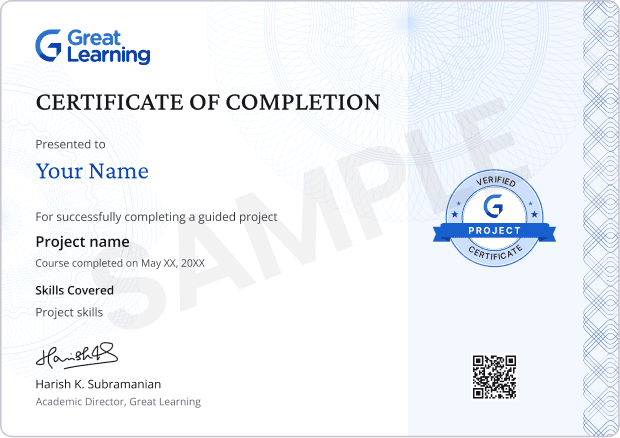
Get a project certificate to add to your resume
Earn a certificate for every project you complete.
- GUIDED PROJECT 1
- Retail Sales Analysis
- In this project, we will be looking at retail sales data, which contains information such as transaction details, product categories, customer demographics, sale prices, discounts, and store performance. This dataset is based on retail transactions in various stores, providing valuable insights into customer behaviour, product performance, and sales trends. Through this project, you will get a glimpse of the dynamics of the retail industry and understand the kind of data and decisions retail managers face.
Gain skills & build your resume with complete access to guided projects in your free trial
Start 7-Day Free TrialCourse Instructors
Mr. R Vivekanand
Co-Founder and Director
Our Learners Experience
Frequently Asked Questions
What will I learn in this Tableau course?
The course includes basics of visual analytics and how to structure data effectively for accurate analysis and visualization, Basic Charts & Calculations, and advanced chart types such as heat maps and histograms to represent complex data insights effectively. You will also learn how to create dynamic, interactive visualizations in Tableau using parameters to enhance user experience, and build interactive dashboards by combining multiple visualizations for impactful data presentations. Lastly, you will learn how to structure visualizations to craft a clear and compelling data-driven story.
What is the Tableau Data Visualization Essentials course?
This Tableau course teaches you how to create impactful data visualizations and dashboards using Tableau. You will learn visual analytics, data structuring, advanced chart types, parameterized reporting, and storytelling through data. It’s designed to equip you with the skills needed for roles in business intelligence and reporting through data visualization using Tableau.
What topics does this Tableau course cover?
The Tableau training course covers visual analytics, data structures, chart types, calculations, advanced visualizations such as heat maps and histograms, working with parameters, dashboard creation, and data storytelling in Tableau. It’s tailored for practical application in business intelligence and data visualization using Tableau.
Can I learn Tableau online?
Yes, this online course can be completed at your own pace through Great Learning’s platform.
What is the course duration, and how is it structured?
The course includes 8 hours of video content and 1 guided project. This Tableau course online is designed to be hands-on, helping you apply what you learn through practical exercises and real-world data.
Does the course include hands-on projects or practice?
Yes, the course includes 1 guided project in which you will apply the concepts learned to real-world data, helping you practice creating interactive dashboards and meaningful visualizations in Tableau
Is this Tableau training suitable for beginners?
Yes, the course starts with the basics of visual analytics and data structures, then progresses to advanced topics such as dashboard creation and storytelling. It’s ideal for beginners who want to learn Tableau and enhance their skills in data visualization using Tableau.
Do I receive a certificate after completing this Tableau training?
Yes, upon successful completion of the course, you will receive an industry-recognized certificate that you can showcase on LinkedIn and add to your resume, helping you stand out to employers in data visualization Tableau courses.
What is the difference between this Pro and the free online Tableau training course on Great Learning Academy?
This Pro course gives more structured, in-depth personalized learning with hands-on guided projects, AI tools, mock interviews, and a certificate recognized by the industry. It provides hands-on applications and advanced ideas that extend beyond the fundamentals learnt in free courses, ensuring you learn to become a true professional and confidently approach interviewing for jobs.
Can I complete this Tableau course online at my own pace?
Yes, this Tableau training course is fully online and can be completed at your own pace. You can access the course materials anytime, making it flexible and easy to fit into your schedule while learning Tableau.
What skills will I gain by the end of this Tableau course for Data Visualization?
By the end of the course, you will gain skills in visual analytics, data structuring, creating basic and advanced charts, working with interactive parameters, building dashboards, and storytelling with Tableau, preparing you for a career in data visualization.
What kind of career opportunities will this Tableau course open up?
This course will prepare you for roles in business intelligence, data analysis, and dashboard design. You’ll be equipped to present data insights effectively and make data-driven decisions, a critical skill in many industries requiring data visualization Tableau courses.
How does this Tableau training course differ from free courses?
This premium Tableau training offers a more structured, in-depth learning experience, including hands-on projects and an industry-recognized certificate. It covers advanced topics and practical applications beyond the basics provided in free Tableau training courses, helping you gain expertise in data visualization using Tableau.
Subscribe to Academy Pro+
Build skills and prepare for jobs with access to 500+ courses, certificates and tools.
Subscribe To Pro+ • $25/MonthSkill Prep
Build skills with courses, practice with tools and earn certificates.
500+ courses
500+ Coding Exercises
Microsoft & AWS certificates

Job Prep
Work on industry-relevant scenarios, build professional resumes & prepare for jobs with mock interviews
50+ Guided Projects
AI Resume Builder
AI mock interviews




.jpg)





 (1).png)




.png)
 (1).jpg)

.png)

.png)
.png)
.png)
.png)
.png)
.png)
.png)


.png)
.png)
.png)




.png)



.png)
.png)
.png)


.jpg)
.png)
.png)
.png)
.jpg)

.jpg)
.jpg)
.jpeg)
.jpg)
.jpg)
.png)
