Excel for Data Analysis Course
Master Data Analytics in Excel
Learn Data Visualization, Data Cleaning, Pivot Tables, Advanced Formulas, and Business Analytics through real-world projects. Join this Excel for Data Analysis Course and develop the skills to analyze and manage data effectively.
About this course
In this Excel for Data Analysis course, you’ll learn the essential skills for working with data, from basic handling to advanced techniques such as data cleaning, aggregation, and analysis. You’ll master functions for navigating data, applying conditional operations, and performing analysis with PivotTables and visualizations. The course also covers Exploratory Data Analysis (EDA), helping you identify trends and patterns through univariate, bivariate, and multivariate analyses.
The guided projects will help you develop the expertise to clean, process, and analyze complex datasets, empowering you to make data-driven decisions and generate actionable insights that drive business success.
After you finish this Data Analysis with Excel course, you'll be proficient in data analysis, cleaning, and visualization, with the ability to uncover actionable insights from real-world data, valuable in roles such as data analysis, business intelligence, and operations optimization.
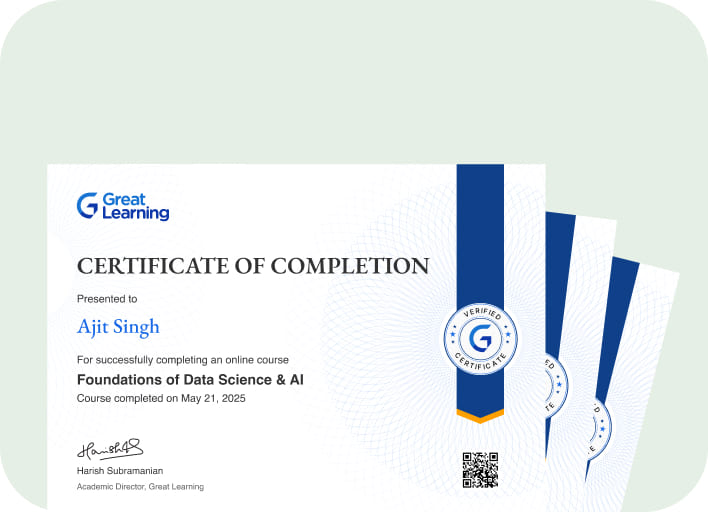
Earn a certificate with an Academy Pro+ subscription
Stand out to recruiters
Share on professional channels
Globally recognised
Land your dream job

Course outline
Industry focussed curriculum designed by experts
Introduction to Data Analytics
2 videos
20 mins
- Components of Analytics
- Analytics Lifecycle
Fundamentals of Excel in Data Analytics
11 videos
1 hour 20 mins
- Introduction to Excel
- Excel Navigation
- Rows, Columns & Cells
- Basic Math with Excel
- Boolean Operations
- Cell Referencing
- Information Functions
- Counting
- Filtering & Sorting
- Finding & Searching Text
- Joining Text
1 Quiz
- Quiz to test your understanding of excel fundamentals
Data Handling and Analysis in Excel
7 videos
1 hour and 14 mins
- Basics of Date and Time
- Finding Difference Between Dates
- Advanced Text Operations
- Conditional Operations
- Aggregation
- Conditional Aggregation
- Indexing & Matching
1 Quiz
- Data handling quiz to test your understanding
Data Cleaning, Analysis, and Visualization in Excel
6 videos
1 hour and 15 mins
- Data Cleaning using Functions
- Conditional Formatting
- Data Validation
- Lookup Functions in Excel
- Pivot Tables
- Data Visualization using Excel
1 Quiz
- Quiz to test your understanding of Data Cleaning and Analysis
Exploratory Data Analysis (EDA)
10 videos
2 hours
- Introduction to Exploratory Data Analysis with Excel
- Problem Statement
- Data Understanding
- Questions & Hypothesis
- Data Cleaning & Manipulation
- Univariate Analysis
- Exploratory Data Analysis- Hands-on- Part 1
- Exploratory Data Analysis- Hands-on- Part 2
- Exploratory Data Analysis- Hands-on- Part 3
- Quick peek into the final insights
1 Quiz
- Quiz to test your understanding of EDA concepts
Guided Excel Project 1 : E-Commerce
Guided Excel Project 2 : Aviation Sector Analysis using Excel
Mock Interview - Excel Specialist
Get access to the complete curriculum with your free trial
Start 7-Day Free TrialGuided Projects
Solve real-world projects in this data analysis excel course with a step-by-step guide, starter code templates, and access to model solutions to boost your skills and build a standout resume.

Get a project certificate to add to your resume
Earn a certificate for every project you complete.
- GUIDED PROJECT 1
- AeroMax Airways: Data-Driven Insights for Optimizing Airline Operations and Passenger Experience
- This project involves analyzing a large dataset from the aviation sector, including flight delays, passenger demographics, ticket pricing, and operational costs. Participants will uncover insights into flight delays, identify congested airports, analyze passenger satisfaction trends, and evaluate financial performance. The project emphasizes data cleaning, processing, and visualization to derive actionable recommendations for improving punctuality, enhancing customer experience, and optimizing profitability in the airline industry.
- GUIDED PROJECT 2
- StellarMart Analytics: Optimizing Retail Performance Through Data Insights
- This project focuses on analyzing a retail dataset from StellarMart to identify sales trends, seasonal patterns, regional performance, and underperforming product categories. We will clean and process data, create dynamic visualizations, and generate actionable insights to support strategic decisions and drive profitability. Deliverables include an organized Excel workbook with cleaned data, aggregated metrics, and visualizations tailored for retail analytics
Gain skills & build your resume with complete access to guided projects in your free trial
Start 7-Day Free TrialCourse Instructors
Denver Dias
Senior Data Science Consultant
Gaelim Holland
Senior Data Analyst | Power BI Expert | Data Visualization | Data Scientist
Our Learners Experience
Frequently Asked Questions
What will I learn in this Data Analytics in Excel course?
You learn how to use Excel for data analysis from the basics to advanced techniques. You start with the role of analytics, the analytics lifecycle, and how Excel fits into data work. You then learn data handling, formulas, cell referencing, Boolean logic, text functions, date and time functions, conditional functions, lookup functions, and aggregation. You also learn data cleaning, data validation, conditional formatting, PivotTables, charts, and exploratory data analysis. The course ends with two guided projects that help you apply everything you learned.
What skills will I gain from this Excel data analytics course?
You will gain the following skills:
- Excel Basics
- Formulas and Functions
- Data Cleaning
- Conditional Functions
- Lookup Functions
- Data Validation
- Conditional Formatting
- Text Functions
- Date & Time Functions
What is the course duration, and what assistance can I get?
The Excel for Data Analysis online course offers about 5.5 hours of video lessons and 2 guided Data Analysis in Excel projects. You will also be given 24-hour AI assistance.
What guided projects are included in this Data Analysis Using Excel course?
You work on two guided projects:
The first project focuses on an aviation dataset, analyzing flight delays, scheduling issues, and operational trends.
The second project focuses on a retail dataset where you study sales trends, regional performance, product patterns, and other insights.
These projects help you practice analysis, cleaning, PivotTables, charts, and reporting.
Do I get a certificate after completing this Excel analytics course?
Yes, you receive a certificate after finishing the course with an active Academy Pro+ plan. The certificate is linked to the Pro+ subscription and adds value to your resume and LinkedIn profile.
Does this online Excel course for data analysis include a mock interview?
Yes, the course includes a mock interview focused on common Excel questions that appear in data analyst hiring. This helps you prepare for real interviews and discuss the skills you learn in the course.
Do I need any specific prerequisites for this data analysis Excel training?
You only need basic computer skills and access to Excel. The course teaches all analytics concepts and Excel features from the ground up.
How will this data analyst Excel course help my career?
This data analyst Excel course builds skills used in roles such as data analyst, business analyst, MIS executive, and reporting analyst. You learn practical workflows for daily tasks such as cleaning data, summarising information, building reports, and presenting insights.
Is the Data Analytics in Excel course self-paced?
Yes, the course is self paced. Once your Academy Pro+ access is active, you can learn anytime and move through the lessons, quizzes, projects, and mock interviews at your own speed.
Is this Data Analysis Excel course suitable for beginners?
Yes, the course works well for beginners. You do not need prior knowledge of analytics or programming. The course starts with simple Excel concepts, then progresses step by step into the skills required for data work.
How is this Pro course different from free Excel courses on Great Learning Academy?
This Pro course provides structured, in-depth personalized learning with hands-on guided projects, AI-powered tools, mock interviews, and an industry-recognized certification. It offers practical applications and advanced concepts that go beyond the basics covered in free courses, helping you build real-world expertise and confidently prepare for job opportunities.
What is the refund policy for Pro courses at Great Learning?
Subscribe to Academy Pro+
Build skills and prepare for jobs with access to 500+ courses, certificates and tools.
Subscribe To Pro+ • $25/MonthSkill Prep
Build skills with courses, practice with tools and earn certificates.
500+ courses
500+ Coding Exercises
Microsoft & AWS certificates

Job Prep
Work on industry-relevant scenarios, build professional resumes & prepare for jobs with mock interviews
50+ Guided Projects
AI Resume Builder
AI mock interviews


.jpg)




 (1).png)




.png)
 (1).jpg)

.png)

.png)
.png)
.png)
.png)
.png)
.png)
.png)


.png)
.png)
.png)




.png)




.png)
.png)
.png)


.jpg)
.png)
.png)

.png)
.jpg)

.jpg)
.jpg)
.jpeg)
.jpg)
.jpg)
.png)
